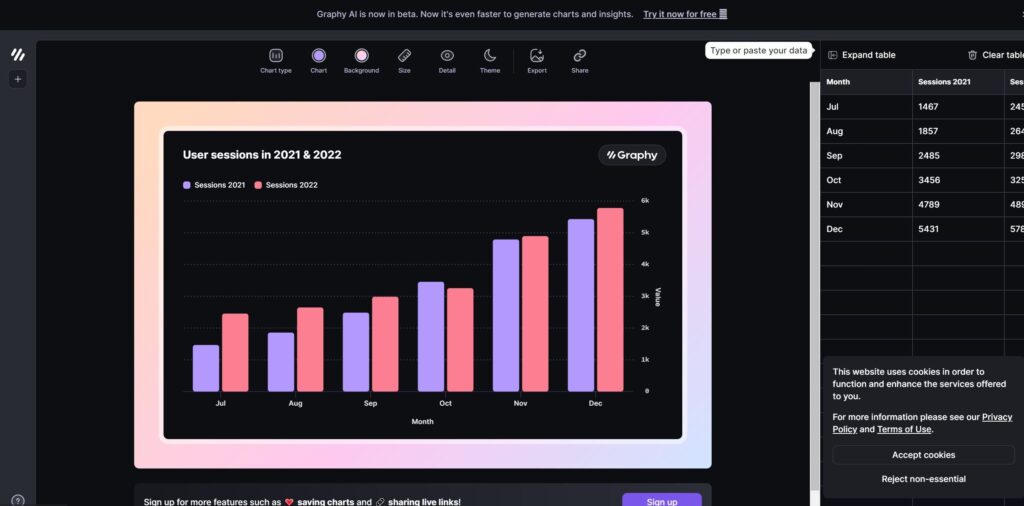
Graphy HQ is an AI-powered tool that helps users analyze their data, charts, and graphs by providing AI-generated insights. Users can input data into the chart generator, and the AI insight feature will generate a summary analysis of the input with customizable options.
Key Features:
-
AI-Generated Insights: Analyze data, charts, and graphs with AI-generated insights to gain a deeper understanding of the trends and patterns within the dataset.
-
Customization Options: Customize the generated insights to focus on specific metrics, variables, or visualizations that are relevant to the analysis.
-
User-Friendly Interface: The tool provides a user-friendly interface for easy data input and exploration of AI-generated insights.
-
Data-Driven Decision Making: Use the insights to make informed decisions and drive business success based on data analysis.
-
Accessibility: Graphy HQ aims to make data analysis accessible to users with varying levels of technical expertise, simplifying the process through AI-generated insights.
Use Cases:
-
Business analysts and data scientists looking for a tool to assist in analyzing and interpreting their data.
-
Marketing professionals analyzing campaign performance, customer behavior, and market trends.
-
Researchers and academics analyzing survey data, experimental results, and statistical trends.
-
Sales teams examining sales figures, forecasting, and identifying patterns in customer behavior.
-
Individuals and organizations seeking to gain insights from their data to inform decision-making and strategy.
Graphy HQ is a powerful tool that combines the capabilities of AI and data analysis to provide users with valuable insights from their data, charts, and graphs.


Social media not available for this tool